Polling Places | Exploratory Data Analysis
By Justin S.
- 11 minutes read - 2186 wordsIn a democracy, the polling booth is much more than a location where an unwitting citizen fills in a bubble on a piece of paper in a make-shift booth. It is a symbol of the promise of democracy, a connector between the citizen and the government. It is the shrine that, if protected and respected, powers a democracy.
This article analyzes that symbol of American democracy by taking an analytical look at a dataset of U.S. polling places, compiled by the Center for Public Integrity. Thanks to the great work done by CPI, information on polling place locations and addresses is available for over 30 states for the 2012, 2014, 2016, and 2018 elections. Using a variety of exploratory and modeling techniques, I will analyze the data to answer the following questions:
- Which states provide the most polling places?
- How have the number of polling places trended over time?
- Is the number of polling places proportional to the population in each state?
- Do states that tend to go Republican have less polling places than do states that tend to go Democrat?
Let’s start by taking a look at the data.
| State | Election Date | Jurisdiction Type | Jurisdiction | County Name | Precinct Name | Precinct Id | Polling Place Type | Municipality | Name | Address | Year | County Fips | Zip Code | State Abb | Population | Democratic Votes | Republican Votes | Other Votes | Election | Total Vote |
|---|---|---|---|---|---|---|---|---|---|---|---|---|---|---|---|---|---|---|---|---|
| Alaska | 2012-11-06 | borough | Fairbanks North Star | Aurora | 01-446 | Agricultural Museum - Fairgrounds | 1800 College Road, Fairbanks, AK 99101 | 2012 | 99101 | AK | 730443 | 82927 | 185296 | 21581 | House | 289804 | ||||
| Alaska | 2012-11-06 | borough | Fairbanks North Star | Aurora | 01-446 | Agricultural Museum - Fairgrounds | 1800 College Road, Fairbanks, AK 99101 | 2012 | 99101 | AK | 730443 | 122640 | 164676 | 13179 | President | 300495 | ||||
| Alaska | 2012-11-06 | borough | Fairbanks North Star | Fairbanks No.1 | 01-455 | FNSB Borough Offices | 809 Pioneer Road, Fairbanks, AK 99707 | 2012 | 99707 | AK | 730443 | 82927 | 185296 | 21581 | House | 289804 | ||||
| Alaska | 2012-11-06 | borough | Fairbanks North Star | Fairbanks No.1 | 01-455 | FNSB Borough Offices | 809 Pioneer Road, Fairbanks, AK 99707 | 2012 | 99707 | AK | 730443 | 122640 | 164676 | 13179 | President | 300495 | ||||
| Alaska | 2012-11-06 | borough | Fairbanks North Star | Fairbanks No.2 | 01-465 | Golden Towers | 330 3rd Avenue, Fairbanks, AK 99701 | 2012 | 99701 | AK | 730443 | 82927 | 185296 | 21581 | House | 289804 | ||||
| Alaska | 2012-11-06 | borough | Fairbanks North Star | Fairbanks No.2 | 01-465 | Golden Towers | 330 3rd Avenue, Fairbanks, AK 99701 | 2012 | 99701 | AK | 730443 | 122640 | 164676 | 13179 | President | 300495 | ||||
| Alaska | 2012-11-06 | borough | Fairbanks North Star | Fairbanks No.3 | 01-470 | Noel Wien Library | 1215 Cowles Street, Fairbanks, AK 99701 | 2012 | 99701 | AK | 730443 | 82927 | 185296 | 21581 | House | 289804 | ||||
| Alaska | 2012-11-06 | borough | Fairbanks North Star | Fairbanks No.3 | 01-470 | Noel Wien Library | 1215 Cowles Street, Fairbanks, AK 99701 | 2012 | 99701 | AK | 730443 | 122640 | 164676 | 13179 | President | 300495 | ||||
| Alaska | 2012-11-06 | borough | Fairbanks North Star | Fairbanks No.4 | 01-475 | National Guard Armory | 202 Wien Street, Fairbanks, AK 99701 | 2012 | 99701 | AK | 730443 | 82927 | 185296 | 21581 | House | 289804 | ||||
| Alaska | 2012-11-06 | borough | Fairbanks North Star | Fairbanks No.4 | 01-475 | National Guard Armory | 202 Wien Street, Fairbanks, AK 99701 | 2012 | 99701 | AK | 730443 | 122640 | 164676 | 13179 | President | 300495 | ||||
| Alaska | 2012-11-06 | borough | Fairbanks North Star | Fairbanks No.5 | 01-480 | Pioneer Park Centennial Center | 2300 Airport Way, Fairbanks, AK 99707 | 2012 | 99707 | AK | 730443 | 82927 | 185296 | 21581 | House | 289804 | ||||
| Alaska | 2012-11-06 | borough | Fairbanks North Star | Fairbanks No.5 | 01-480 | Pioneer Park Centennial Center | 2300 Airport Way, Fairbanks, AK 99707 | 2012 | 99707 | AK | 730443 | 122640 | 164676 | 13179 | President | 300495 | ||||
| Alaska | 2012-11-06 | borough | Fairbanks North Star | Fairbanks No.6 | 01-485 | Shopper’s Forum Mall | 1255 Airport Way, Fairbanks, AK 99707 | 2012 | 99707 | AK | 730443 | 82927 | 185296 | 21581 | House | 289804 | ||||
| Alaska | 2012-11-06 | borough | Fairbanks North Star | Fairbanks No.6 | 01-485 | Shopper’s Forum Mall | 1255 Airport Way, Fairbanks, AK 99707 | 2012 | 99707 | AK | 730443 | 122640 | 164676 | 13179 | President | 300495 | ||||
| Alaska | 2012-11-06 | borough | Fairbanks North Star | Fairbanks No.7 | 01-490 | JP Jones Community Dev Center | 2400 Rickert Street, Fairbanks, AK 99707 | 2012 | 99707 | AK | 730443 | 82927 | 185296 | 21581 | House | 289804 | ||||
| Alaska | 2012-11-06 | borough | Fairbanks North Star | Fairbanks No.7 | 01-490 | JP Jones Community Dev Center | 2400 Rickert Street, Fairbanks, AK 99707 | 2012 | 99707 | AK | 730443 | 122640 | 164676 | 13179 | President | 300495 | ||||
| Alaska | 2012-11-06 | borough | Fairbanks North Star | Fairbanks No.10 | 01-495 | Pioneer Park Centennial Center | 2300 Airport Way, Fairbanks, AK 99707 | 2012 | 99707 | AK | 730443 | 82927 | 185296 | 21581 | House | 289804 | ||||
| Alaska | 2012-11-06 | borough | Fairbanks North Star | Fairbanks No.10 | 01-495 | Pioneer Park Centennial Center | 2300 Airport Way, Fairbanks, AK 99707 | 2012 | 99707 | AK | 730443 | 122640 | 164676 | 13179 | President | 300495 | ||||
| Alaska | 2012-11-06 | borough | Fairbanks North Star | Badger No.2 | 02-345 | Badger Plaza | 771 Badger Road, Fairbanks, AK 99711 | 2012 | 99711 | AK | 730443 | 82927 | 185296 | 21581 | House | 289804 | ||||
| Alaska | 2012-11-06 | borough | Fairbanks North Star | Badger No.2 | 02-345 | Badger Plaza | 771 Badger Road, Fairbanks, AK 99711 | 2012 | 99711 | AK | 730443 | 122640 | 164676 | 13179 | President | 300495 | ||||
| Alaska | 2012-11-06 | borough | Fairbanks North Star | Fairbanks No.8 | 02-355 | Frontier Outfitters/Gavora Mall | 250 Third Street, Suite 6, Fairbanks, AK 99701 | 2012 | 99701 | AK | 730443 | 82927 | 185296 | 21581 | House | 289804 | ||||
| Alaska | 2012-11-06 | borough | Fairbanks North Star | Fairbanks No.8 | 02-355 | Frontier Outfitters/Gavora Mall | 250 Third Street, Suite 6, Fairbanks, AK 99701 | 2012 | 99701 | AK | 730443 | 122640 | 164676 | 13179 | President | 300495 | ||||
| Alaska | 2012-11-06 | borough | Fairbanks North Star | Fairbanks No.9 | 02-365 | Tanana Middle School | 600 Trainor Gate Road, Fairbanks, AK 99701 | 2012 | 99701 | AK | 730443 | 82927 | 185296 | 21581 | House | 289804 | ||||
| Alaska | 2012-11-06 | borough | Fairbanks North Star | Fairbanks No.9 | 02-365 | Tanana Middle School | 600 Trainor Gate Road, Fairbanks, AK 99701 | 2012 | 99701 | AK | 730443 | 122640 | 164676 | 13179 | President | 300495 | ||||
| Alaska | 2012-11-06 | borough | Fairbanks North Star | Fort Wainwright | 02-375 | Last Frontier Community Activity Center | 1044 Apple Street, Fort Wainwright, AK 99703 | 2012 | 99703 | AK | 730443 | 82927 | 185296 | 21581 | House | 289804 |
In the dataset we can see quite a bit of information! Each row corresponds to a polling place available during a given election. So in 2012 at the Agricultural Museum - Fairgrounds polling place, there were two elections: one for House races and one for President, thus resulting in two rows of our dataset. For each polling place we can see a few things of interest, including the location of the site, the number of people who voted in that state election (NOT the number of people who voted at that site), the population of the state, and so on.
Using this data, let’s try to understand trends in the number of polling places in each state. We’ll start by looking at the relationship between the number of polling places and the population of each state.
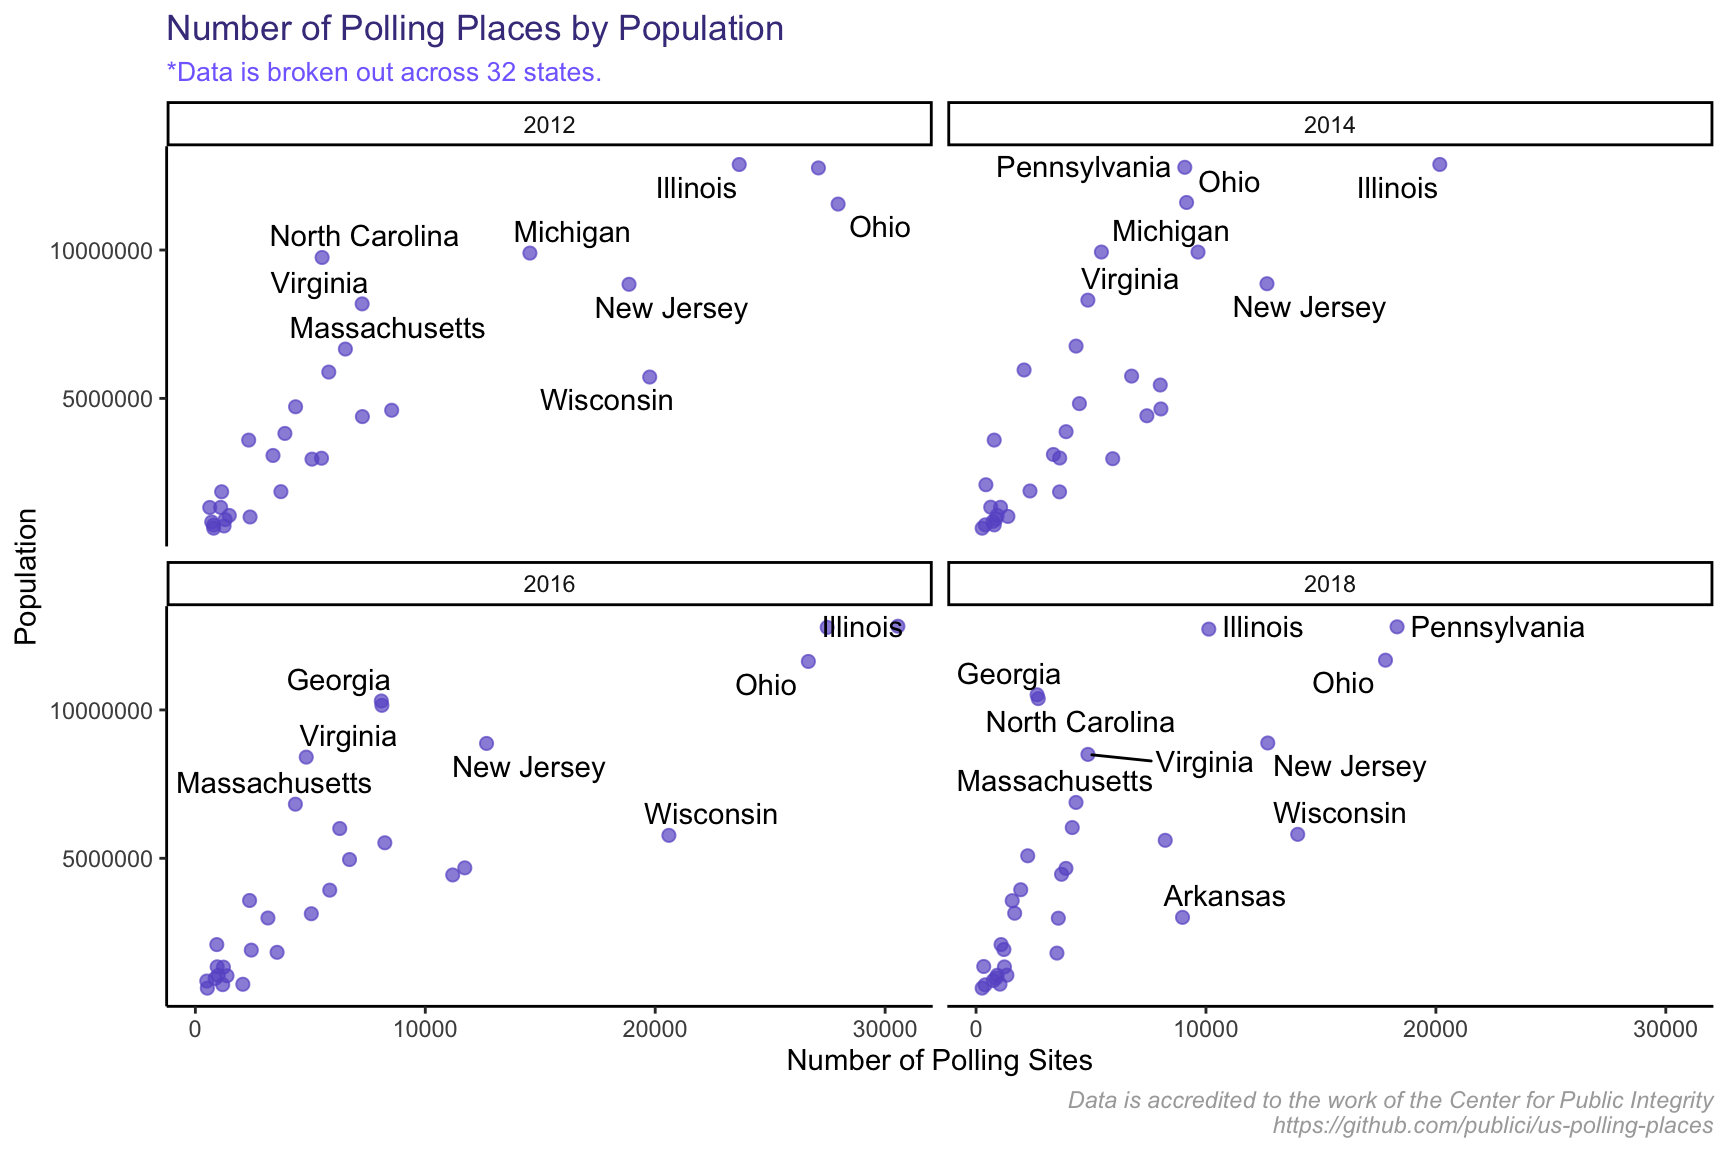
As population increases, the number of polling sites also increases. This trend holds steadily true for each election, regardless of whether there was a Presidential election (2012 + 2016) or just House/Senate elections (2014 + 2018).
Let’s get a better look at which states had proportionally more polling places than they did general population (the per capita rate).
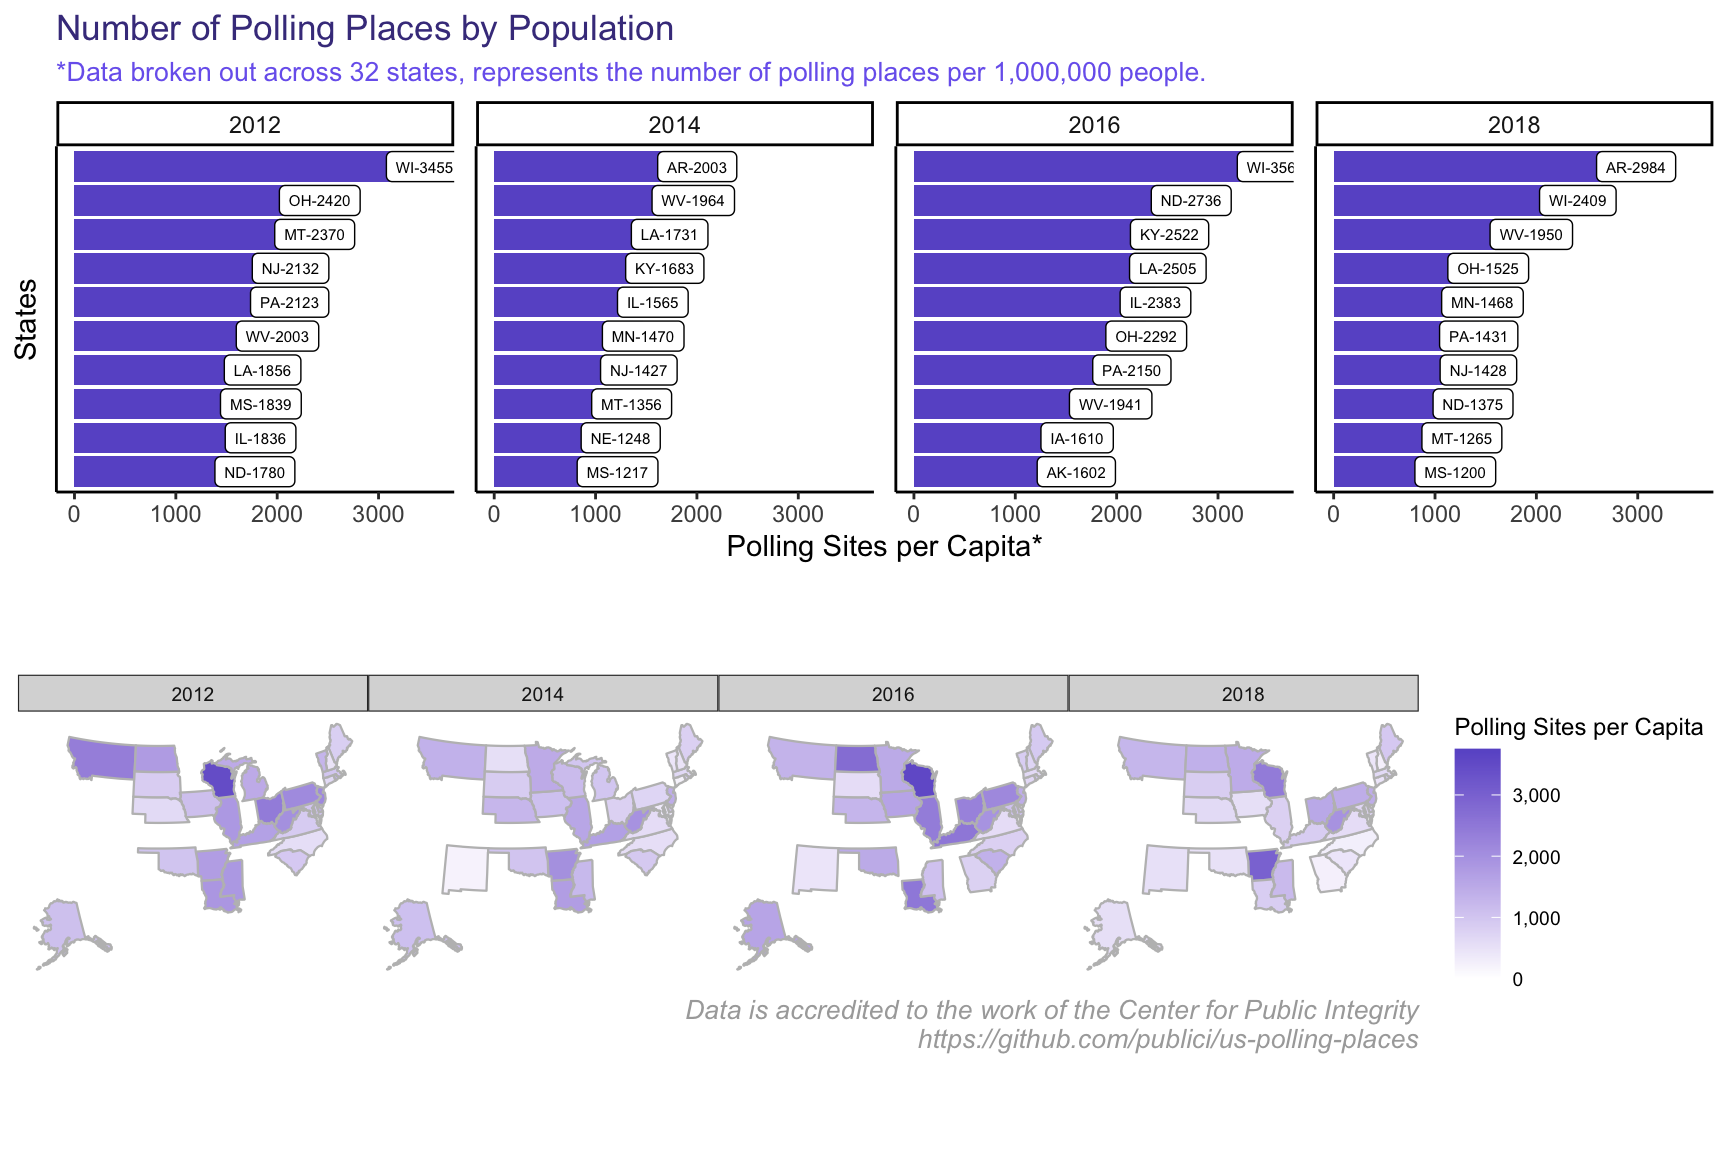 Above I’ve stacked a bar chart showing the top 10 states by polling sites per capita on top of a map-based visualization showing the same. Although there isn’t much of a geographic differentiation in the number of polling sites per capita by state (it definitely hurts that CPI has only collected this data for 32 states), I do notice that the numbers aren’t skewed by Northeast vs. South, which would have been my initial assumption. It’s also clear that states commission more public polling sites during Presidential election years than off-cycle years.
Elections Correlation
In this next section, I’d like to leverage elections data to look at the relationship between the number of polling places in a state and which party won elections in that state. The elections data have been pulled from FEC.gov. In the data, I look at the breakdown, by party, of the House, Senate, and Presidential races and the total number of votes for each in every general election between 2012 and 2018, using that data to match onto the polling places data.
I’ll do so by determining a new variable defined by the overall races won by a political party in a given state. For example, if in New Jersey 2018, Democrats won the House and Senate races, Democrats controlled that election year in NJ. If in Wisconsin, a Republican (Trump) won the Presidential election in 2016, but Democrats overall won the House races, then it’s a “Split Ticket” state.
Let’s start by getting a sense of this new variable. Which party won each state in the past 4 elections?
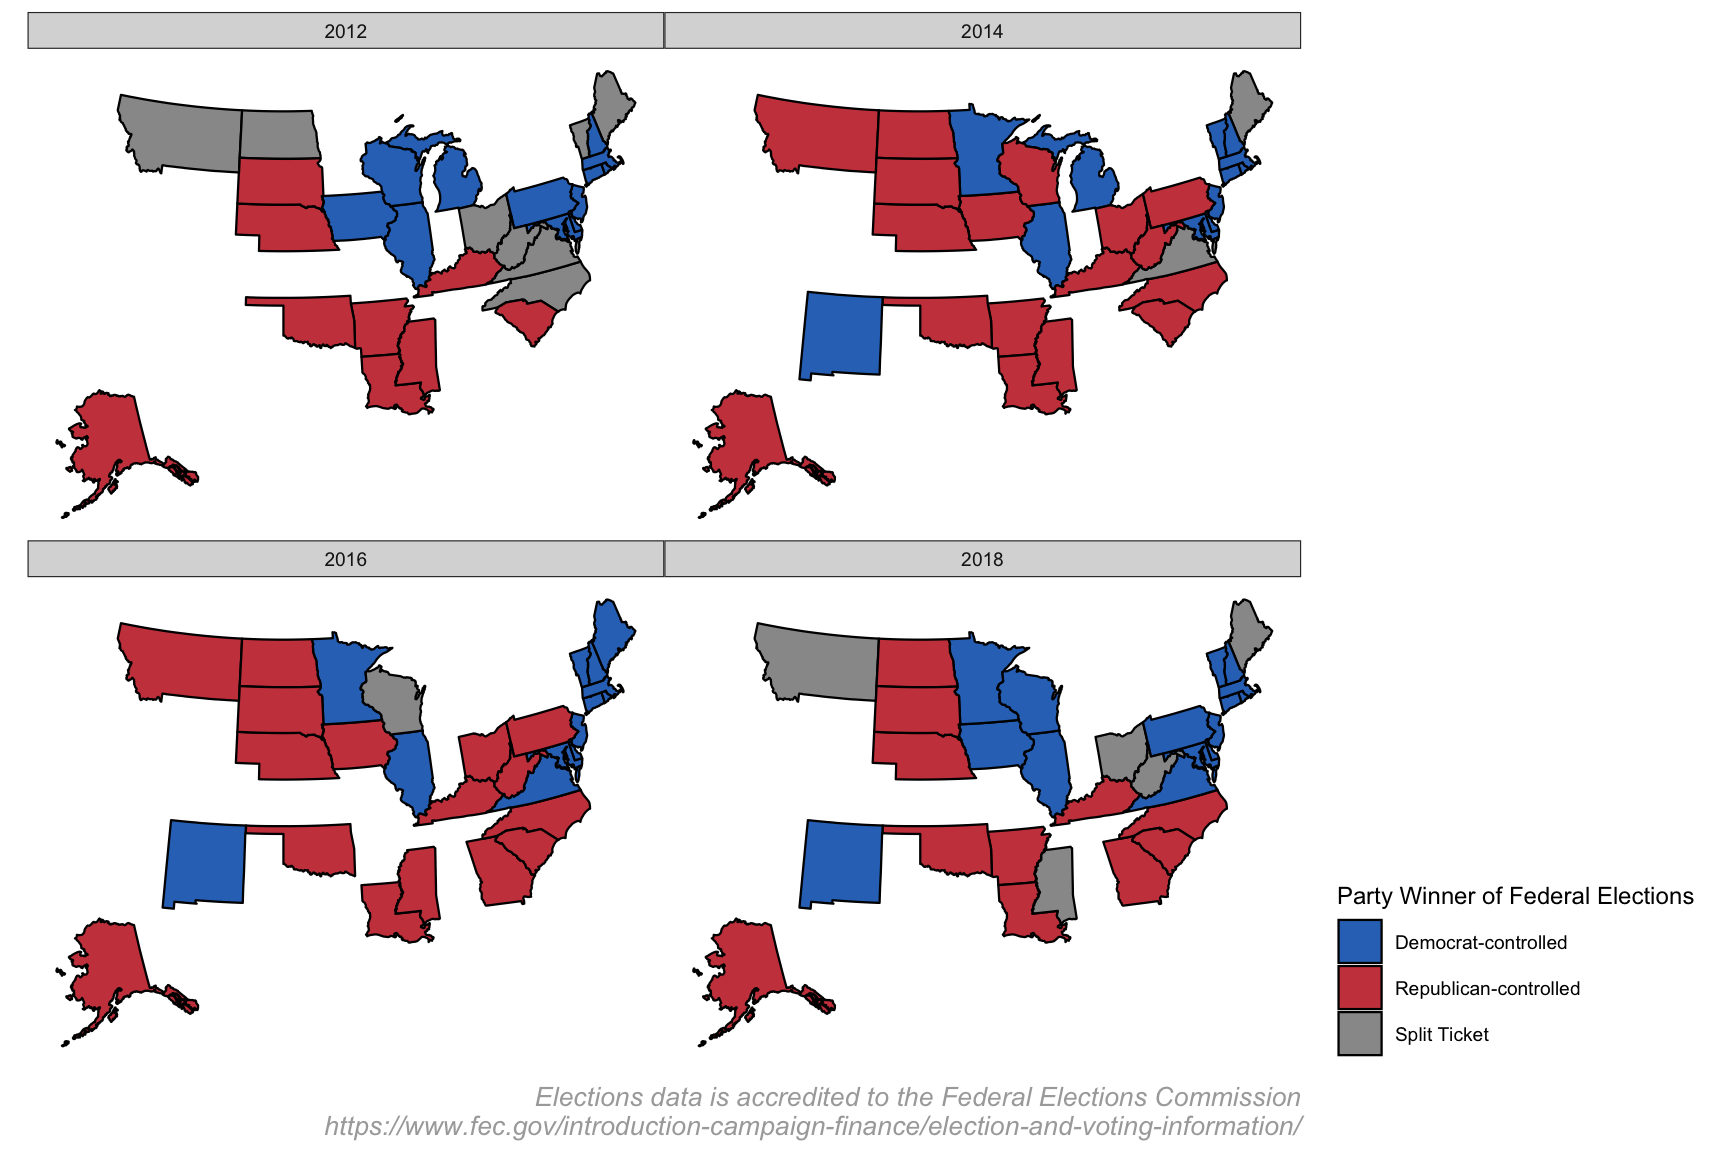
Now that we better understand how this variable works, let’s correlate this against the number of polling sites available to voters in that state. Now that we have our dataset, we’ll build 4 scatter plots (one for each year) of polling places by number of total votes.
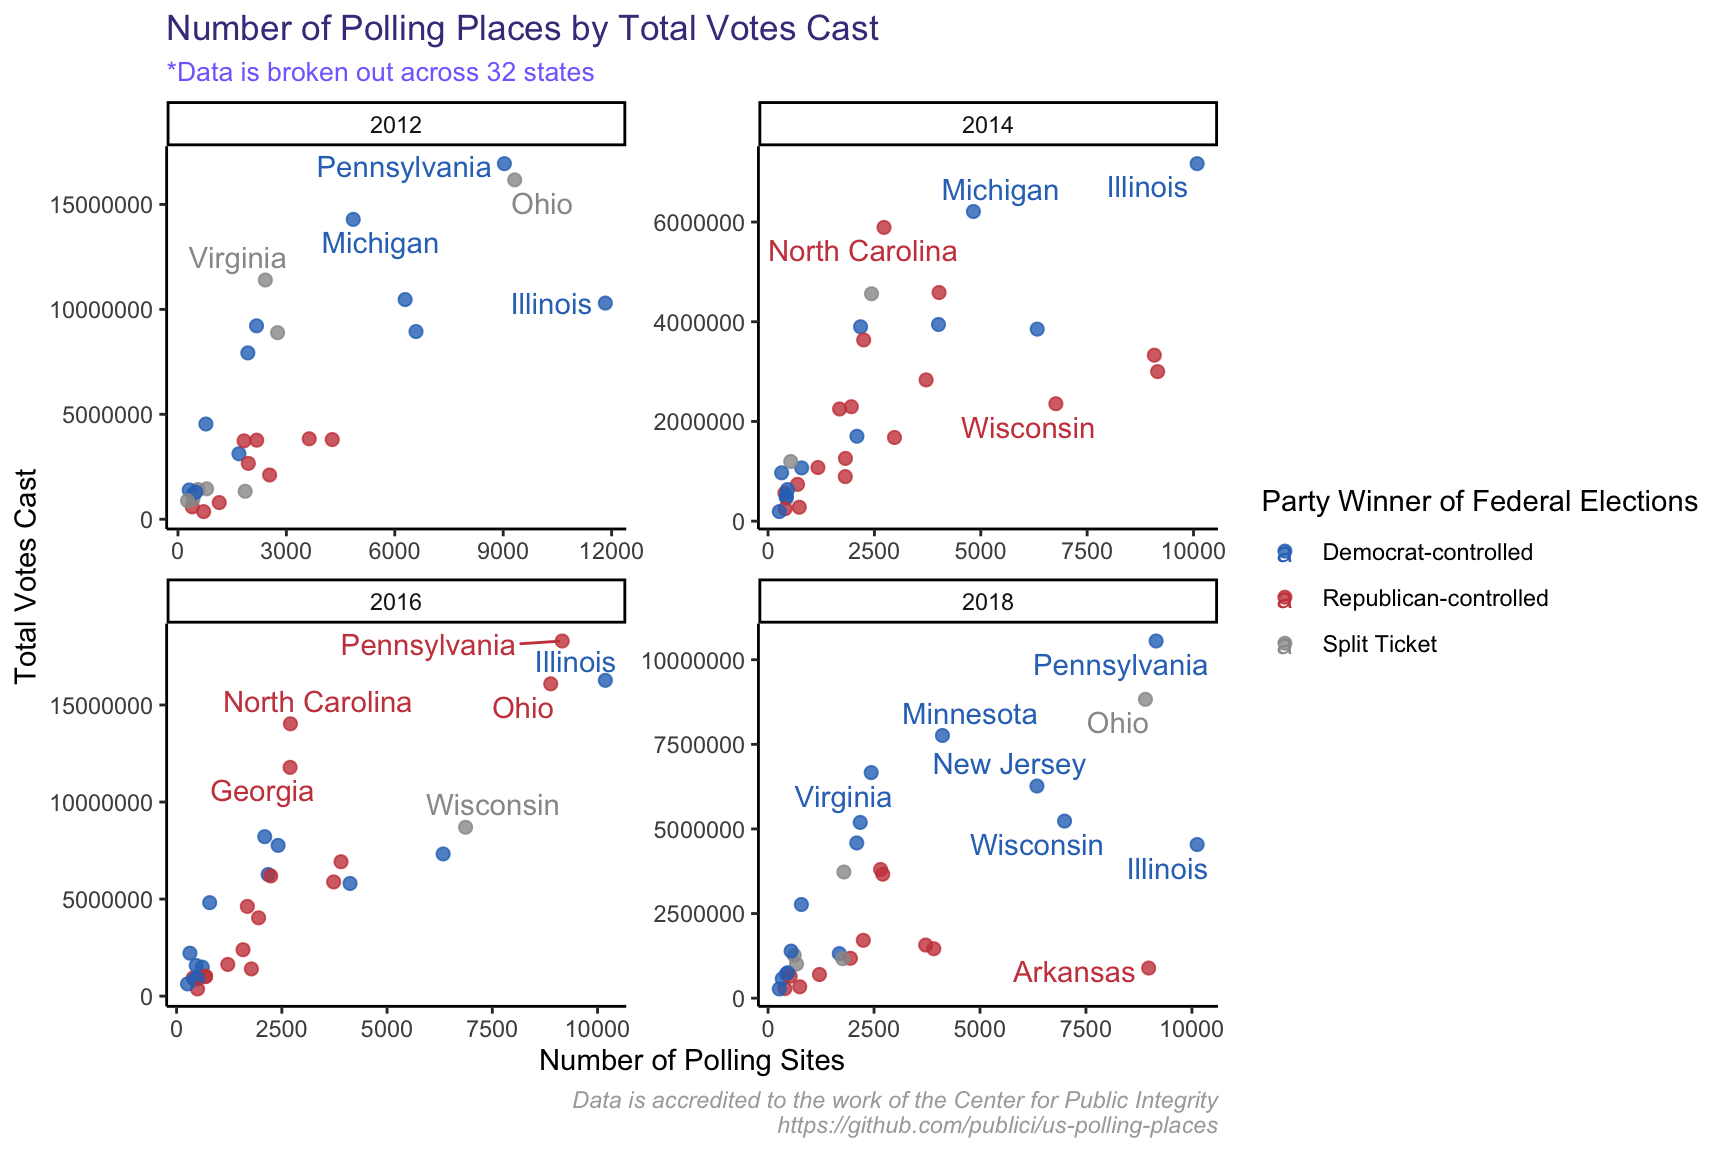
Let’s take another look at our top 10 counts from earlier to see if there’s a correlation with which party won a given state.
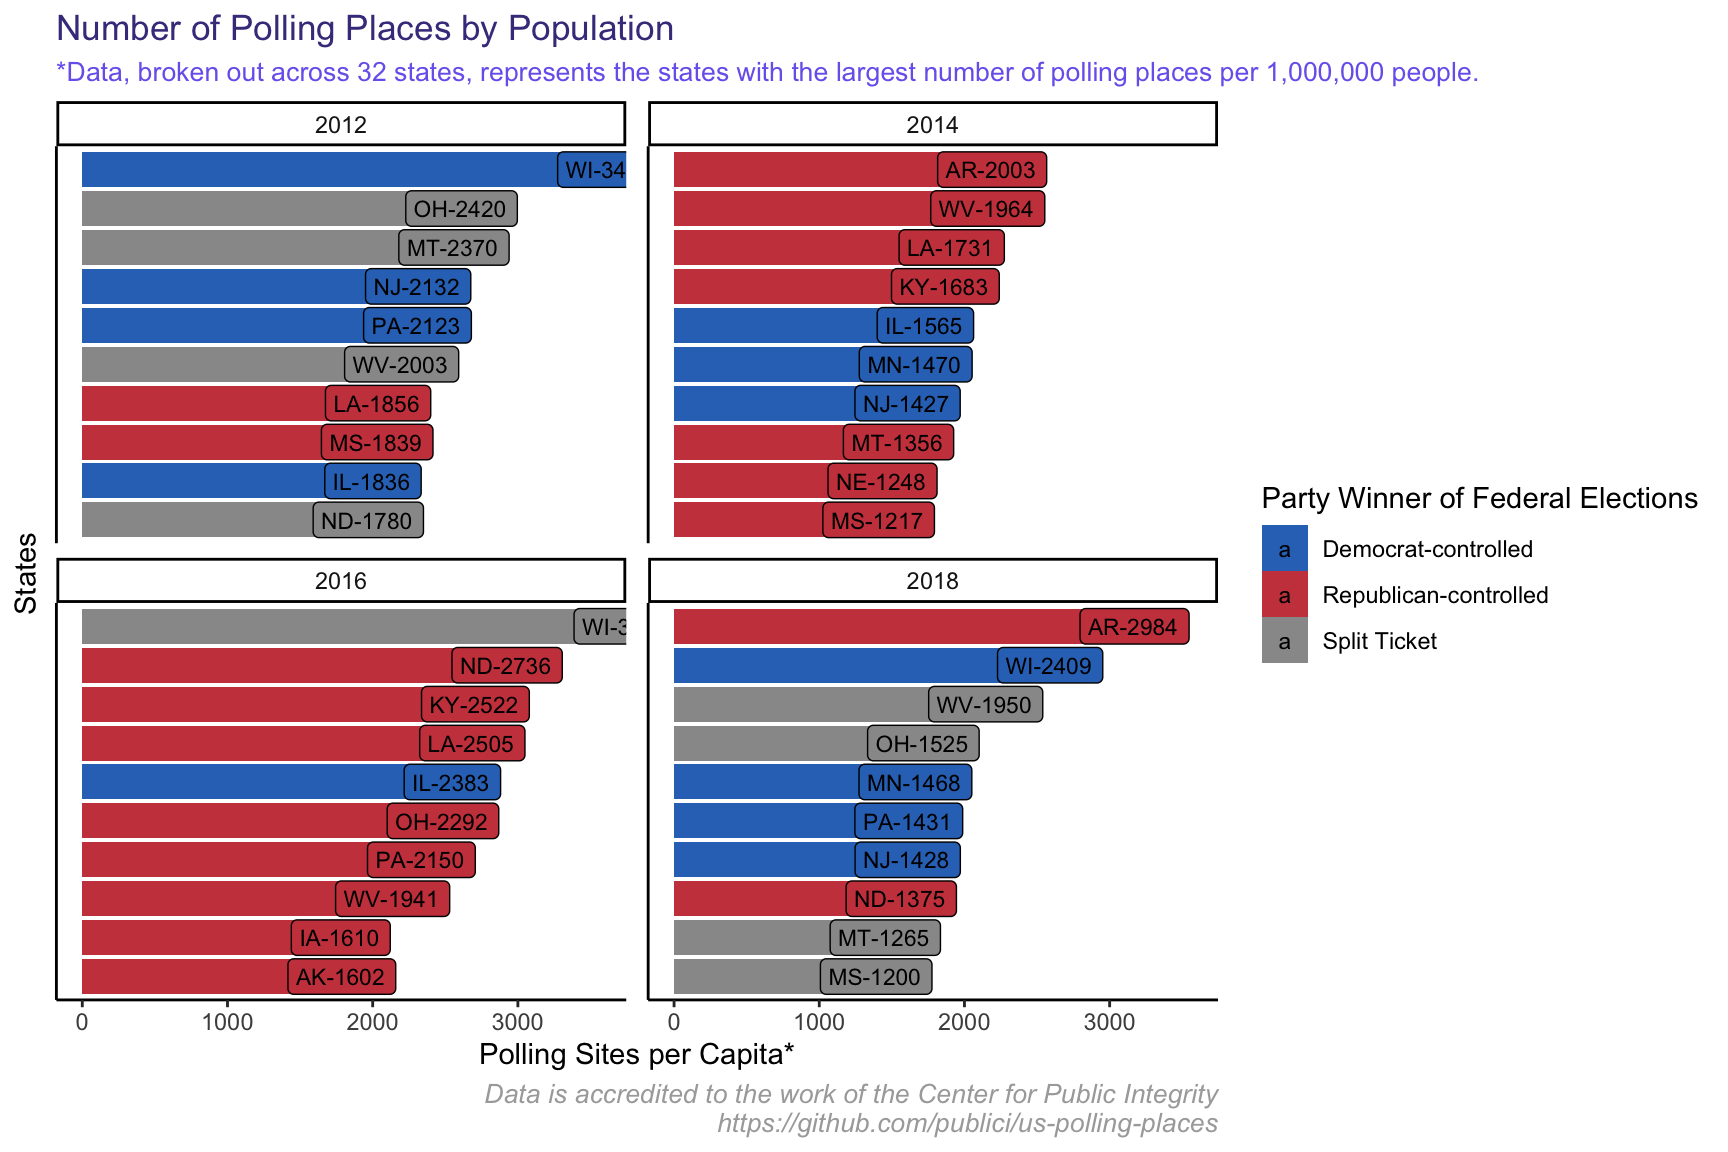
Interestingly enough, in the most notable election covered by our dataset – the 2016 election – states that ended up going full Republican had the most polling places per capita. The state with the most polling places per capita in 2016 – Wisconsin – was notable in that it swung for Trump, much to the Hillary campaign’s surprise.
To be honest, this finding surprises me a bit, especially given a lot of the rhetoric that Republican states go out of their way to make it more difficult for individuals to vote. Obviously this doesn’t tell the full story. Just because there are more polling places does not mean that they are accessible, or that there are a lot of people eligible to vote (because of difficulties in the voter registration process). Still it is a metric that helps understand the fuller picture.
Let’s take a look at our “worst” 10 states to see if this trend reverses.
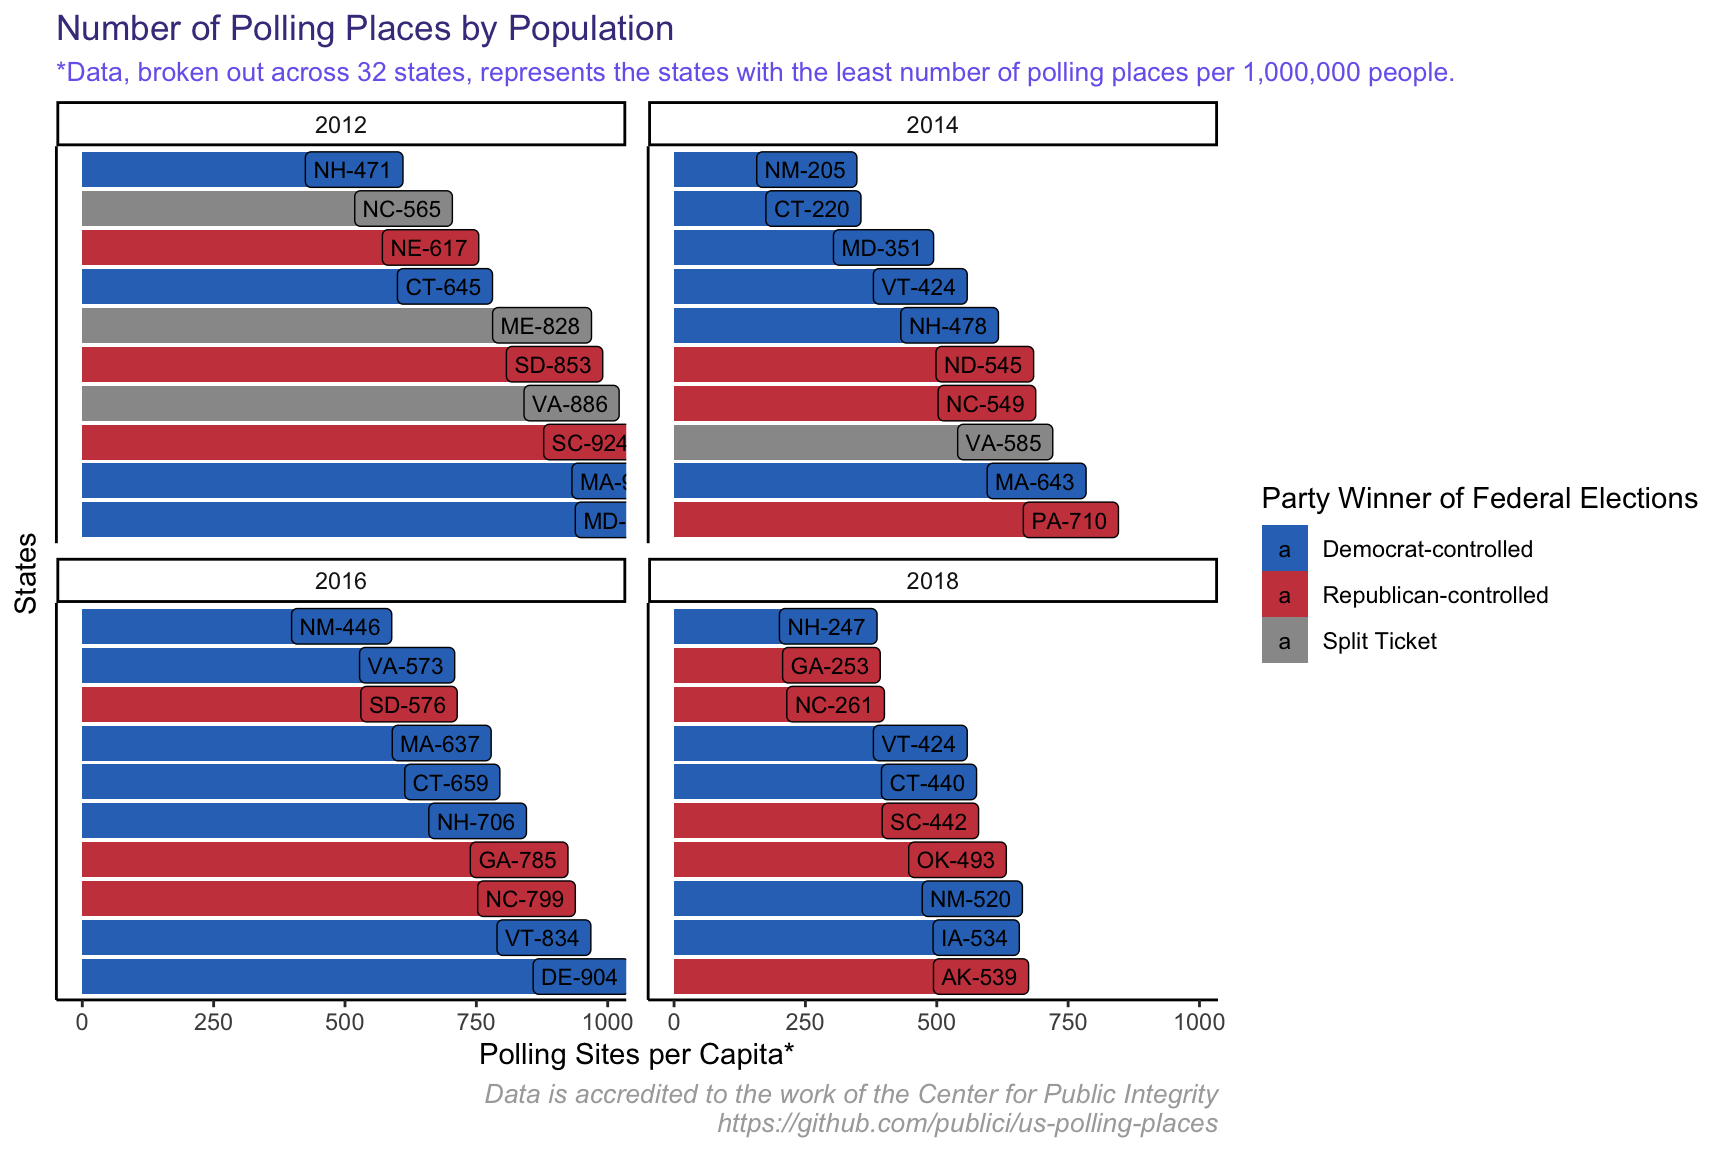
Looking at the bottom polling places makes the argument a bit more muddled. It’s overall a healthier mix of states that went full-Democrat and full-Republican (along with a fair share that had mixed results).
Let’s take a closer look at our House races. Specifically, let’s tie together all three measures we’ve previously been discussing:
1. Number of Polling Sites
2. Number of Votes Cast
3. Total Population
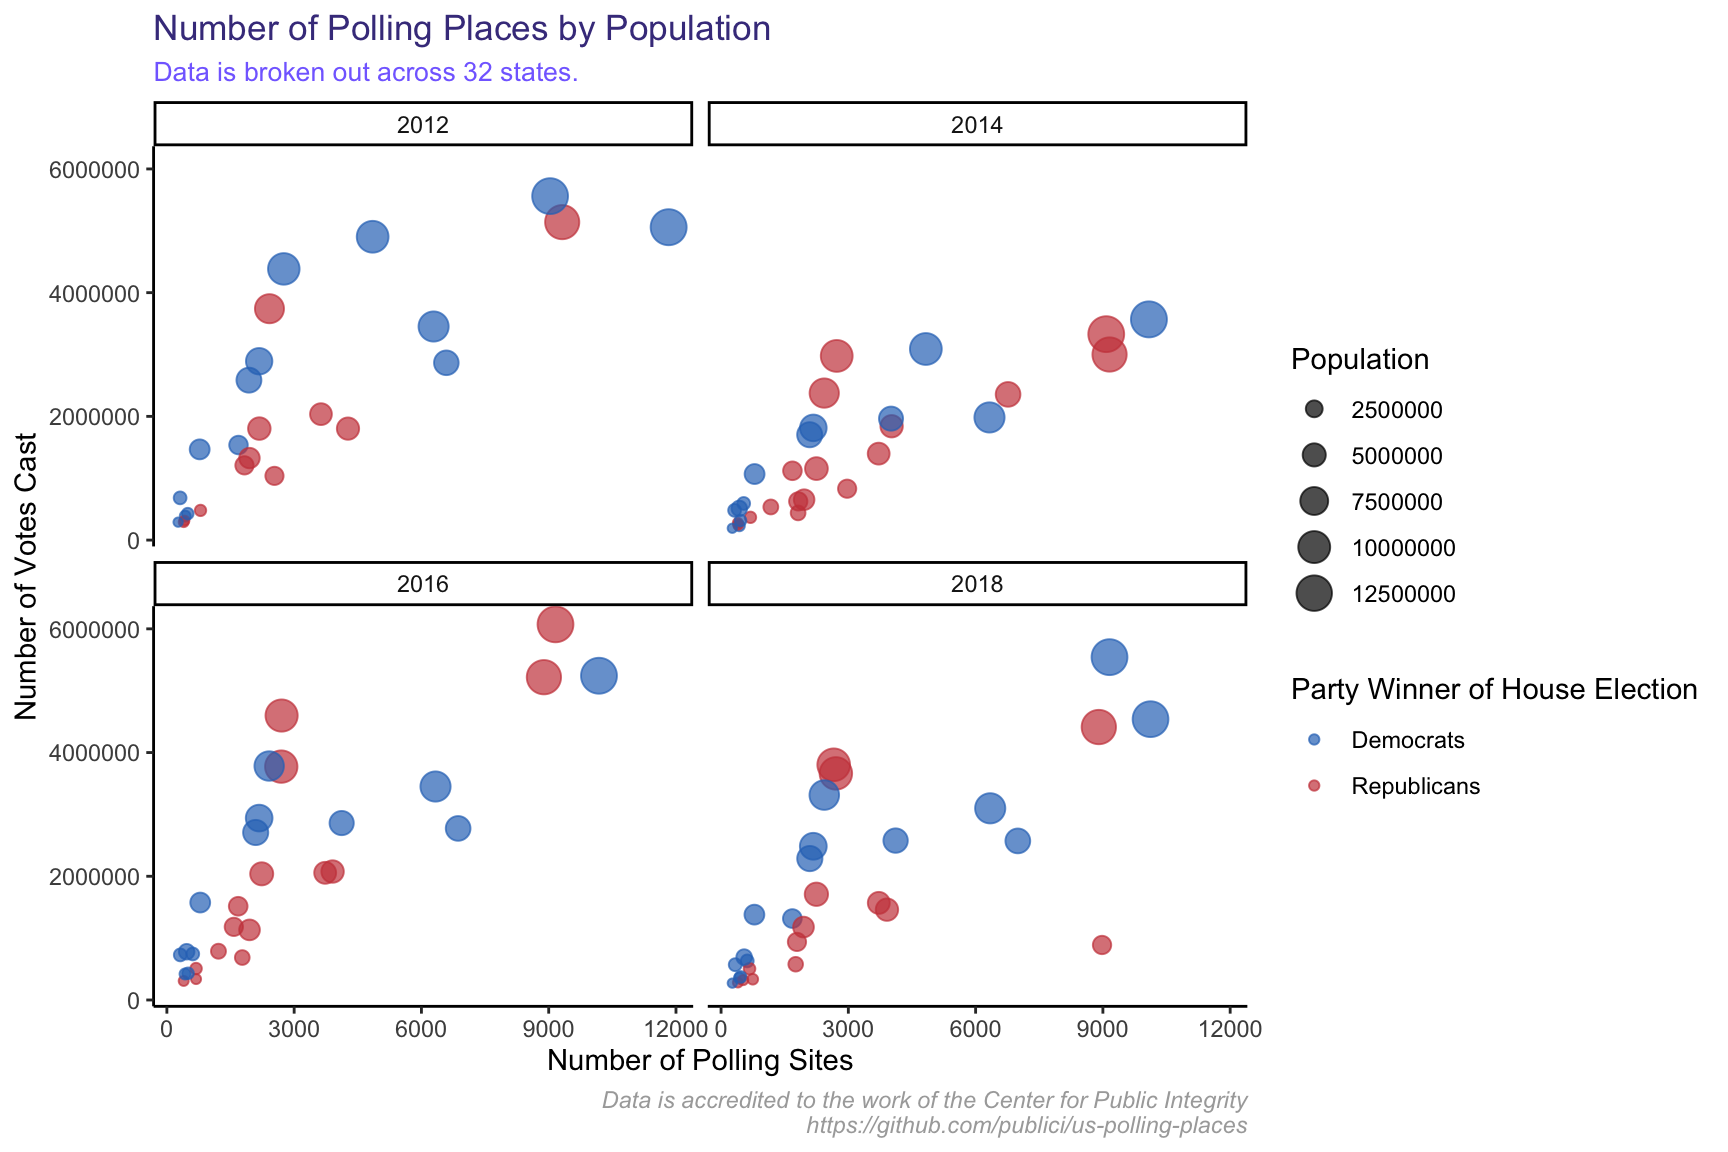
In terms of trend, I can’t see much distinction between states where Republicans won the House versus Democrats. Let’s test this formally using regression. In particular, let’s fit a regression model for House elections, using party, number of votes cast, and population as predictors. We expect, based on the plot above, to see highly correlative relationships between number of votes cast, population, and number of polling places. The real question lies in party.
Here are the results from running a basic regression:
| Estimate | Std. Error | t value | Pr(>|t|) | |
|---|---|---|---|---|
| (Intercept) | -5509 | 145184 | -0.03794 | 0.9698 |
| votes_per_million | 143 | 353.6 | 0.4044 | 0.6867 |
| pop_per_million | 577.6 | 140.5 | 4.112 | 0.00007687 |
| party_winnerRepublican | 291.1 | 323 | 0.9013 | 0.3694 |
| year | 2.594 | 72.04 | 0.03601 | 0.9713 |
| Observations | Residual Std. Error | \(R^2\) | Adjusted \(R^2\) |
|---|---|---|---|
| 113 | 1691 | 0.6776 | 0.6656 |
Looking at the model summary, there are a few interesting things to point out about trends in the number of polling sites in a given state.
- Population | The most important thing to note is that there is only one factor that adequately predicts the number of polling sites: population. The model states that for every additional million people in a state, there will be 577 additional polling sites.
- Total Votes Cast | Now, if you look back at the bubble plot above, you’d probably (like me) assume that the number of total votes cast is also a strong predictor for number of polling sites. As one increases, so does the other. Why then is the p-value (denoted in the model output as PR(>|t|) ) .6867 – much higher than the usual .05 threshold used to determine statistical significance? Well, it’s also true that the number of total votes cast is highly correlated with the population of a state. States with larger populations naturally have more people turn out to vote. Thus, using both features as predictors is redundant.
- Party | The question we’ve all been waiting for. Is it true that the party that wins the House elections in a given state is determinate of the number of polling sites in that state? Turns out, not so much. The p-value for party winner (denoted party_winnerRepublican, representing the base case in which a state goes Republican) is .3694, well above the usual threshold of .05. Thus, we cannot reject our initial null hypothesis that party winner predicts number of polling sites.
Future Analysis
This article really is just a small look at one facet of elections: polling places. Where else should this article go? Well, if I could get my hands on elections data smaller at the county-level or even more granular, I could run a lot of the previous analyses on a much more robust dataset. Unfortunately, that data is expensive.
Otherwise, a good route for this analysis would be to compare the availability of polling places with demographic data on a zip code or county level. The hypothesis here would be that white Americans have better (i.e. more) access to polling places.
Where else should I go with this? Leave your thoughts in the comments.
Blog Post Available on Medium:
https://jschulberg.medium.com/u-s-polling-places-389ca5ed7960